What was the highlight of my Ph.D. work?
One question I often get asked by fellow data scientists in the tech sector is what the highlight of my Ph.D. work was. So, I decided to turn the repetitive answer into a blog post.
The highlight of my Ph.D. work came after I completed my degree; it is one of the projects from my cumulative Ph.D. dissertation that I never got to publish in an academic journal. Below is the version I presented at the 2020 ISPP Annual Meeting.
Decades of academic work on national identity have produced quite a few informative small-scale/partial theories, which have recently become outdated due to multiple reasons, including methodological shortcomings.
By applying a relatively new psychometric toolkit (psychometric networks) to an aggregate nationally representative public opinion data (24 countries), we discovered that national identity is best explained as the broad evaluation of two interrelated questions that individuals ask themselves:
- What does my nation/state provide to me?
- Who do I want to share those resources with?
These broad questions compound the existing partial theories by showing that all the existing psychological constructs (nationalism, patriotism, national pride, conceptions of nationhood & prejudice against out-groups) can actually be summarized in two dimensions.
This collaborative work (with Berna Öney & Chris Cohrs) also overturns some established beliefs in the literature suggesting that national identification leads to nationalism and patriotism, which in turn leads to prejudice. We show that actually, it is nationalism & patriotism that lead to national identification and out-group prejudice is not the ultimate outcome. Moreover, there are notable differences between richer (> median GDP) and poorer (< median GDP) nations when it comes to specific cause & effect mechanisms.
There are many more findings, which I’d not shut up about, but they have no place in a short blog post. Below is more text and visuals for those interested in the methodology and some more specific findings.
Short description of methodology
We used exploratory Gaussian graphical models (GGM) to generate testable hypotheses inductively. We confirmed the network measurement model with the following techniques. After validating the measurement model with a confirmatory GGM technique, we checked whether the measurement model is significantly different from randomly generated networks. We applied item reduction techniques for psychometric networks to reduce the number of nodes in the network and checked whether the network community structure and the dimensionality of the node alignments remain stable. These above-mentioned applications were essential to overcome construct validity shortcomings and statistical power issues. We used a model-based recursive partitioning technique to explain the heterogeneity in the network structures (a fancy way of saying we used a simple machine learning algorithm that tests the moderators). Finally, we used the Bayesian (learning/belief) network application to bring directionality into networks and outline the different cause & effect mechanisms in richer and poorer nations
Key findings
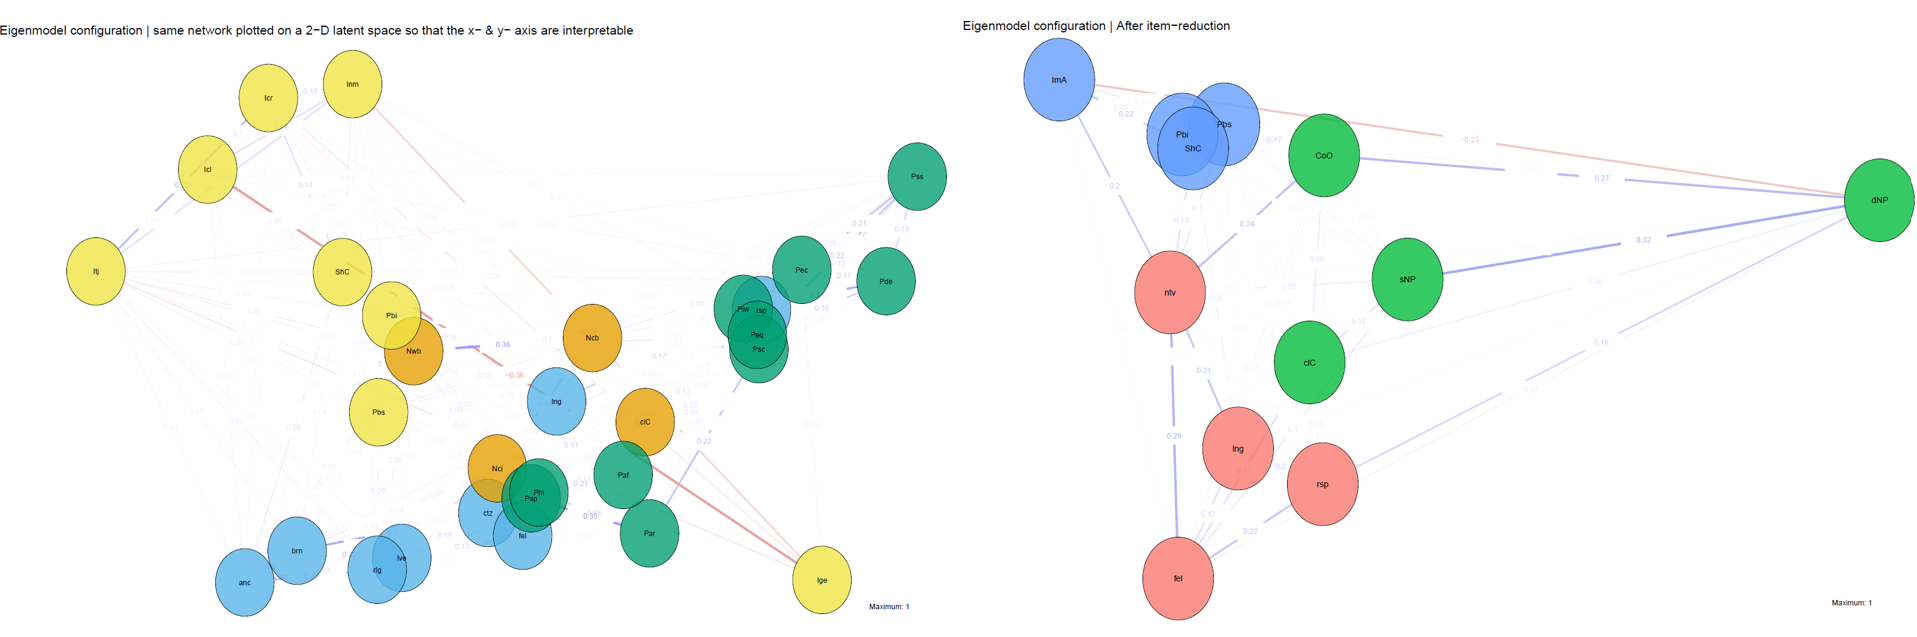
Figure 1
The network on the left (30-nodes) can be reduced to the network on the right (12-nodes). The x-axis reflects the “what does my country/nation provide to me” evaluation; the y-axis is the “who do I want to share these resources with” evaluation.
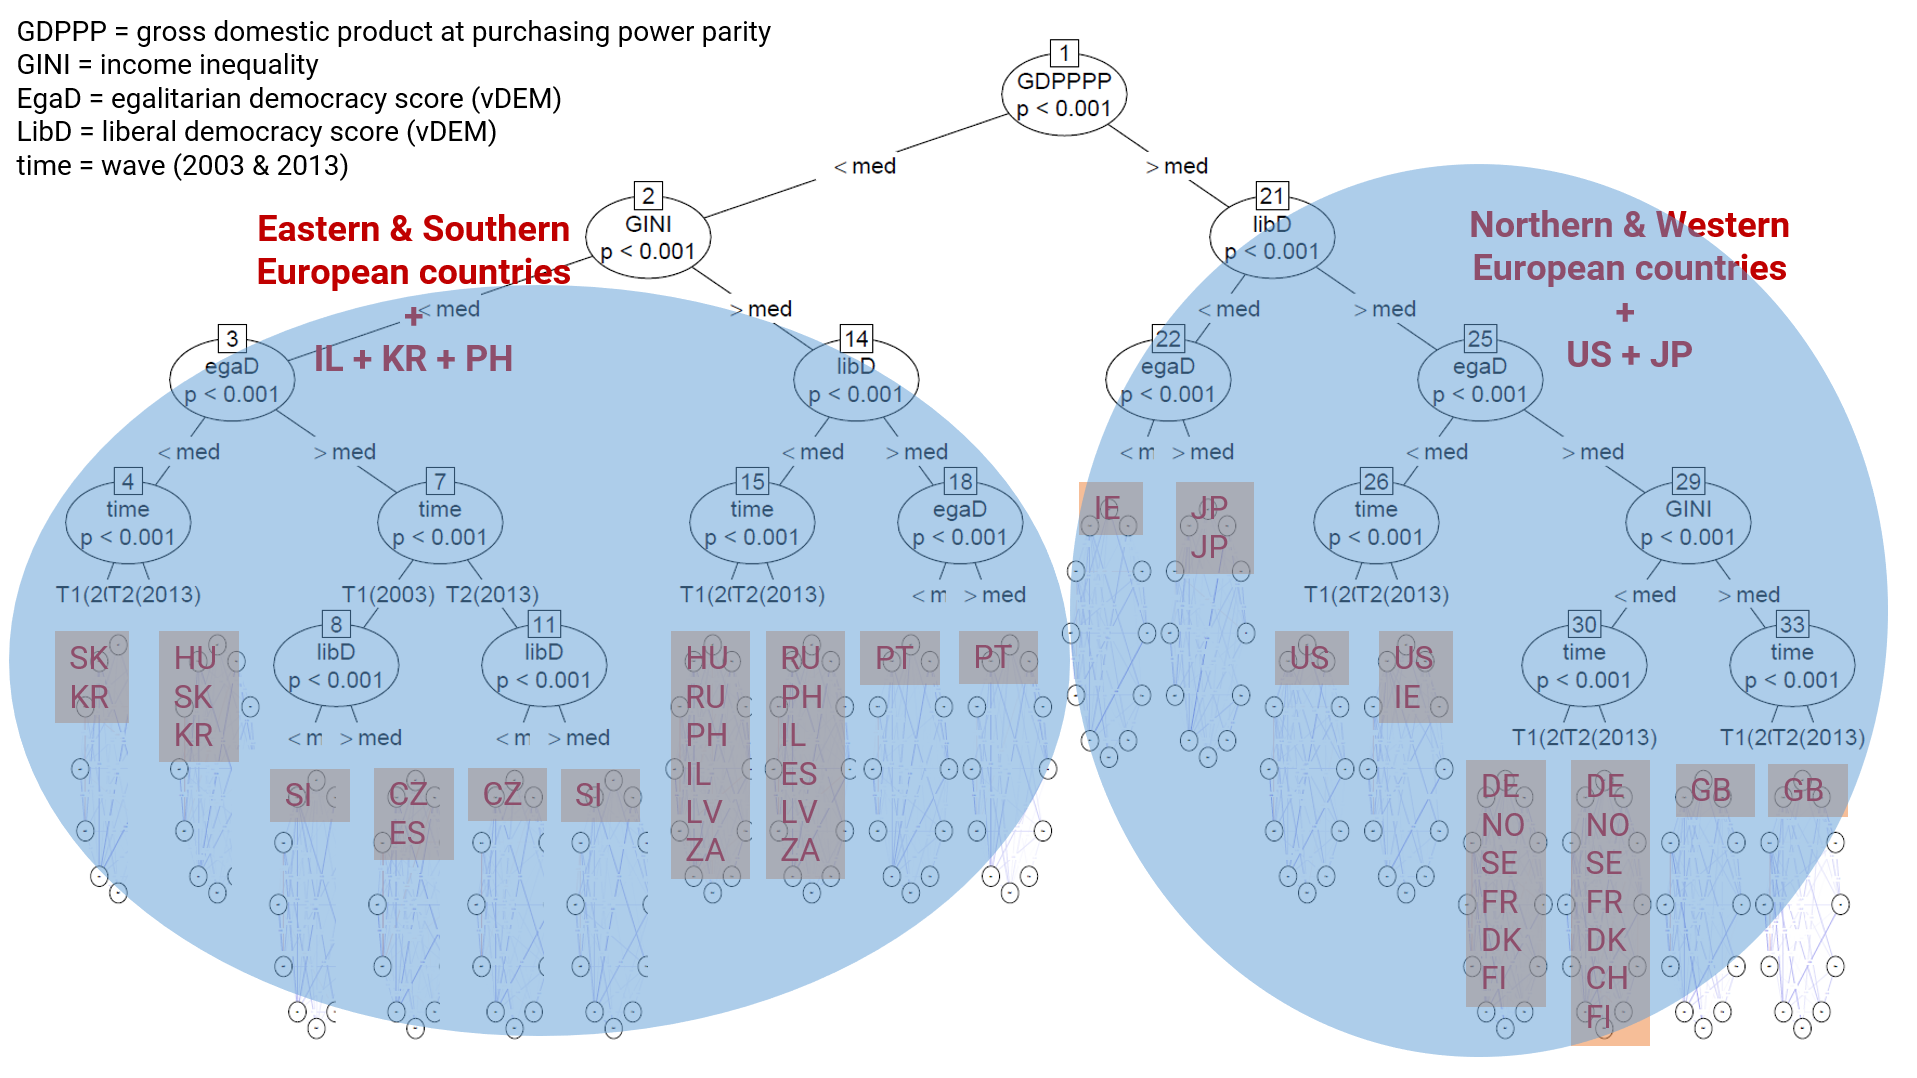
Figure 2
GDP, GINI index (income inequality indicator), level of liberal and egalitarian democracy scores explain the heterogeneity among different country networks. National identity also changes over time.

Figure 3
There are notable differences between richer and poorer nations regarding cause & effect structure in the national identity network structure.
So, there you have it, the highlight of my Ph.D. work. The Data & replication code of this work is available here.